
 Grafana Cloud
Platform
Cost Management and Billing
Analyze and reduce costs
Metrics
Prometheus
Live cardinality management dashboards
Grafana Cloud
Platform
Cost Management and Billing
Analyze and reduce costs
Metrics
Prometheus
Live cardinality management dashboardsAnalyze metrics usage with live cardinality management dashboards
Use the cardinality management dashboards to understand how metrics and labels are distributed across the time series data you send to Grafana Cloud Metrics. The dashboards also provide usage information about your metrics to help you understand which of the metrics you’re storing in Grafana Cloud are being utilized.
If you want historical cardinality, new and unused signals, and one-click remediation actions instead, refer to Analyze historical metrics cardinality in Cost Management and Billing.
In addition, you can use the Adaptive Metrics cost optimization tooling to help reduce costs.
Limitations
- Cardinality management dashboards display data only for metrics and labels within a single stack.
- The cardinality dashboards only work with default Grafana Cloud Prometheus data sources (provisioned by Grafana Cloud at the creation of a stack or org).
- The cardinality management dashboards are focused on exploring your active time series for the last two hours, rather than the complete catalog of all historic time series stored in your Cloud Metrics database. To see historical cardinality, refer to Analyze historical metrics cardinality in Cost Management and Billing. For more information, refer to Active series and DPM.
Access cardinality management dashboards
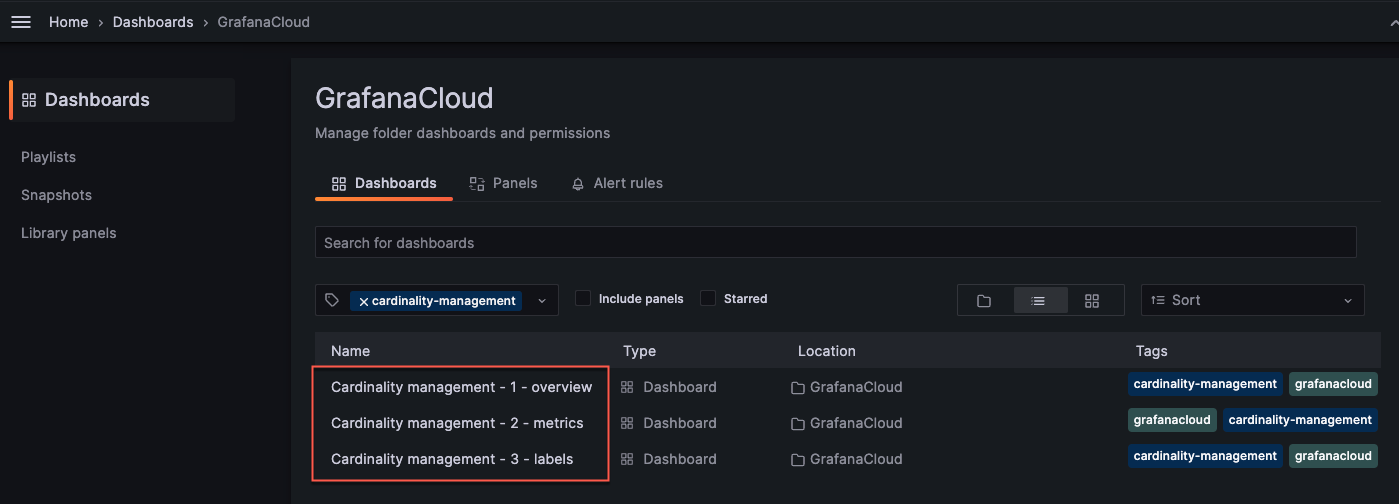
Grafana Cloud provides several, provisioned-by-default dashboards that allow you to visualize and explore the data. To find the dashboards:
Click Dashboards in Grafana Cloud.
Filter by the
cardinality-managementtag and select a cardinality dashboard.![Cardinality management dashboards]()
Cardinality management - overview dashboard
The overview dashboard provides a summary of the highest cardinality metrics and labels in the selected data source.