 GenClass
The dashboard. Every app, every problem, one place.
The genclass.dev dashboard shows what GenClass found in each of your apps, on which pages, and what it did about it, and hands each problem to your coding agent. Free shows one app's totals for the last 7 days and needs no account. Every problem, export and alerts come with Pro.
Get your dashboard
Three ways in:
- With one command:
npx genclassin your app's folder signs you in, starts Pro's 3 free days, adds the app and gives it its dashboard.npx genclass dashboardthen shows it in your terminal: the genclass command. - Without an account: genclass.dev/start gives an app a public token and a private dashboard link. Keep the link private: anyone with it can see that app's stats. You can import the app into an account later, from the Projects page.
- With an account, which keeps your apps in one place: sign up with Google, GitHub, or an email and a password. Your account is your organization, and each app is a project in it: the Projects page lists them, and New project creates one (a name is all it needs).
npx @genclass/runtime@beta logincan also connect an app for you.
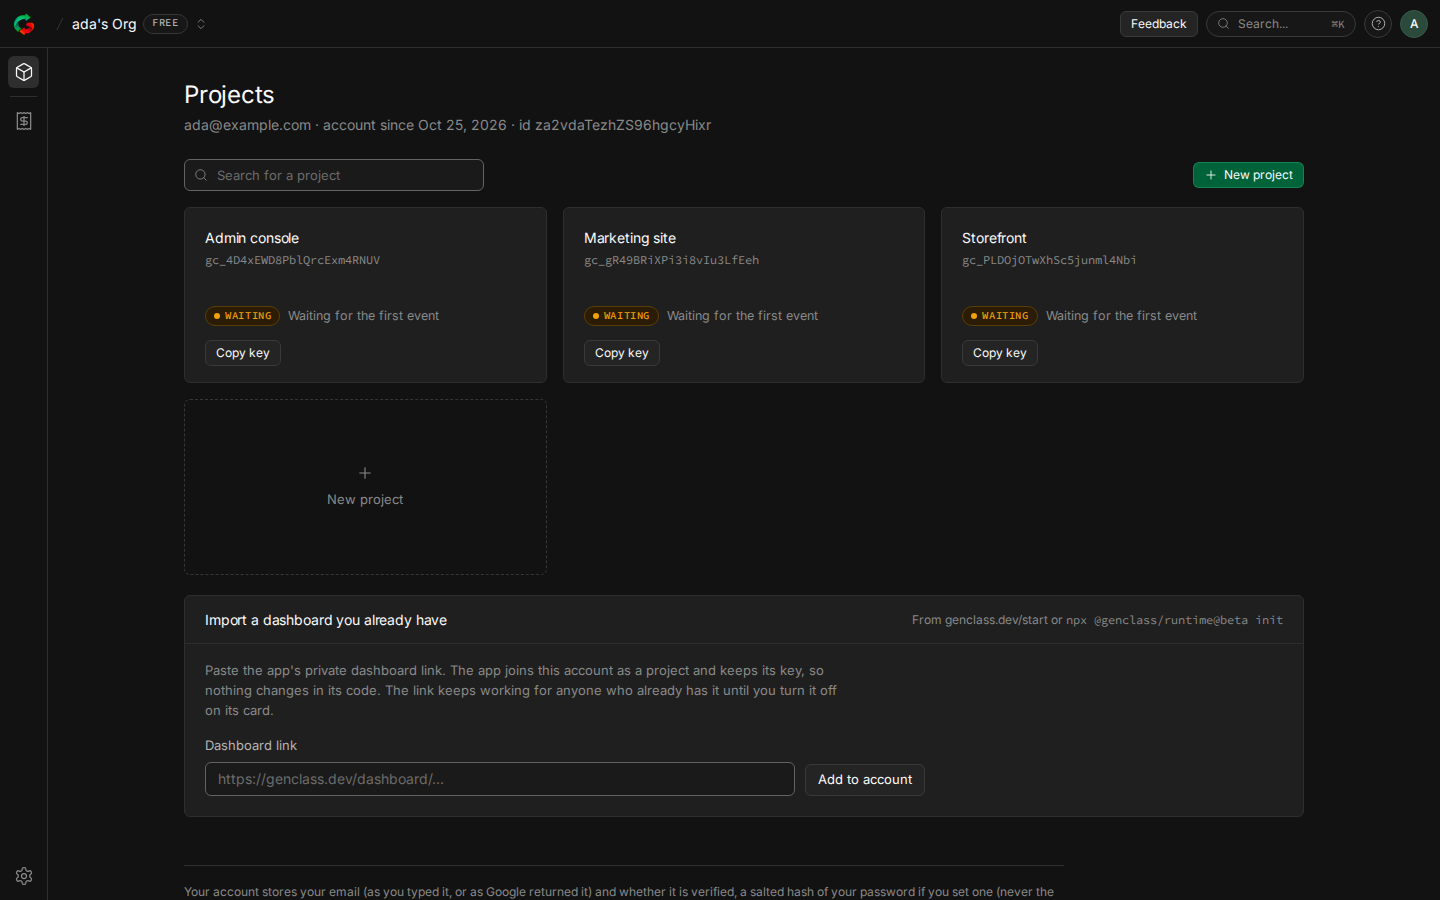
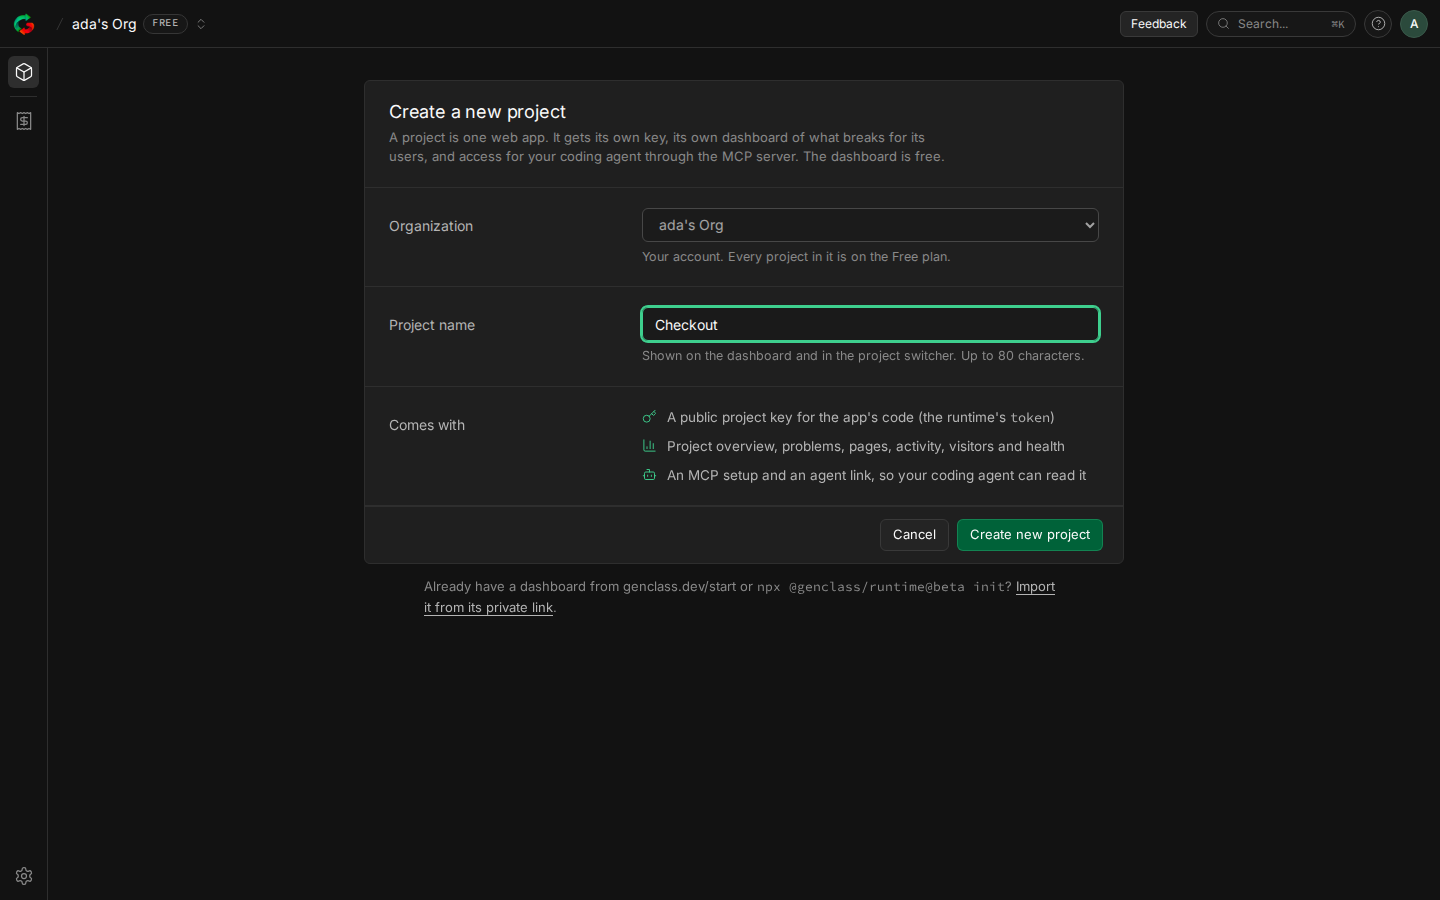
Connect an app
Each project has a key (a token, gc_ and 22 letters and digits). It is public and safe in front-end code: it can only add telemetry to its app. The Connect button at the top of every project opens the Connect dialog, and a new project opens with it. Its tabs:
- Framework: Copy the prompt for your coding agent (paste it into Claude Code, Cursor or Codex and it installs GenClass with this key), or add the key yourself with one of the snippets below.
- API Keys: the project's key, with a copy button.
- MCP: connect your coding agent (below).
- Analytics: one prompt that turns on visitor analytics.
# in the app's folder: sign in, pick the project, review the change, done
npx @genclass/runtime@beta login
<!-- or one script tag -->
<script src="https://cdn.jsdelivr.net/npm/@genclass/runtime@beta" data-token="gc_..."></script>// or in code
import { GenClass } from "@genclass/runtime";
GenClass.init({ token: "gc_..." });Then deploy and load a page. Until the first event arrives, the project shows Getting started and a Waiting badge next to its name; the dialog's status line says Connected when it does, usually within a minute: batches go out every 10 seconds and when a tab is hidden. Local hosts (localhost, *.local, *.test, private networks) do not send by default, so the first event usually comes from your deployed site. Project keys need @genclass/runtime 0.3.0-beta.0 or later (npm i @genclass/runtime@beta); 0.2.x ignores them.
Find your way around
The header shows where you are, your organization / your project: each is a menu, so you can switch projects from anywhere. Next to them are the project's status and Connect; on the right, Feedback, search (Ctrl or ⌘ K jumps to any view or project), help and your account.
The rail on the left switches between views; hold the pointer over it to see their names. Problems, Visitors and Project Settings also have a menu of their own pages next to the rail. The address bar follows, so you can bookmark or share a view (#found, #recent-s, #mcp).
- Project overview: the period at a glance (below).
- Problems: one card per kind of problem, with how often, on which pages, how to fix it, and a prompt for your coding agent. Possible issues are on their own page.
- Pages and Actions: the pages with the most problems, and what GenClass did about them.
- Activity: the latest 50 detections and interventions, newest first.
- Visitors: how people use each page, for apps that turn on interaction analytics.
- Health: whether GenClass could watch your pages at all (model loads, where it ran, decision time), and every counter.
- MCP: connect your coding agent, and the link it reads this project with.
- Loop: what broke, and what your coding agent does with each problem, from reproducing it to a proven fix.
- Integrations and Project Settings (General, API keys, agent access, Export): where problems go, the key, and every event as a file or by API.
Project overview
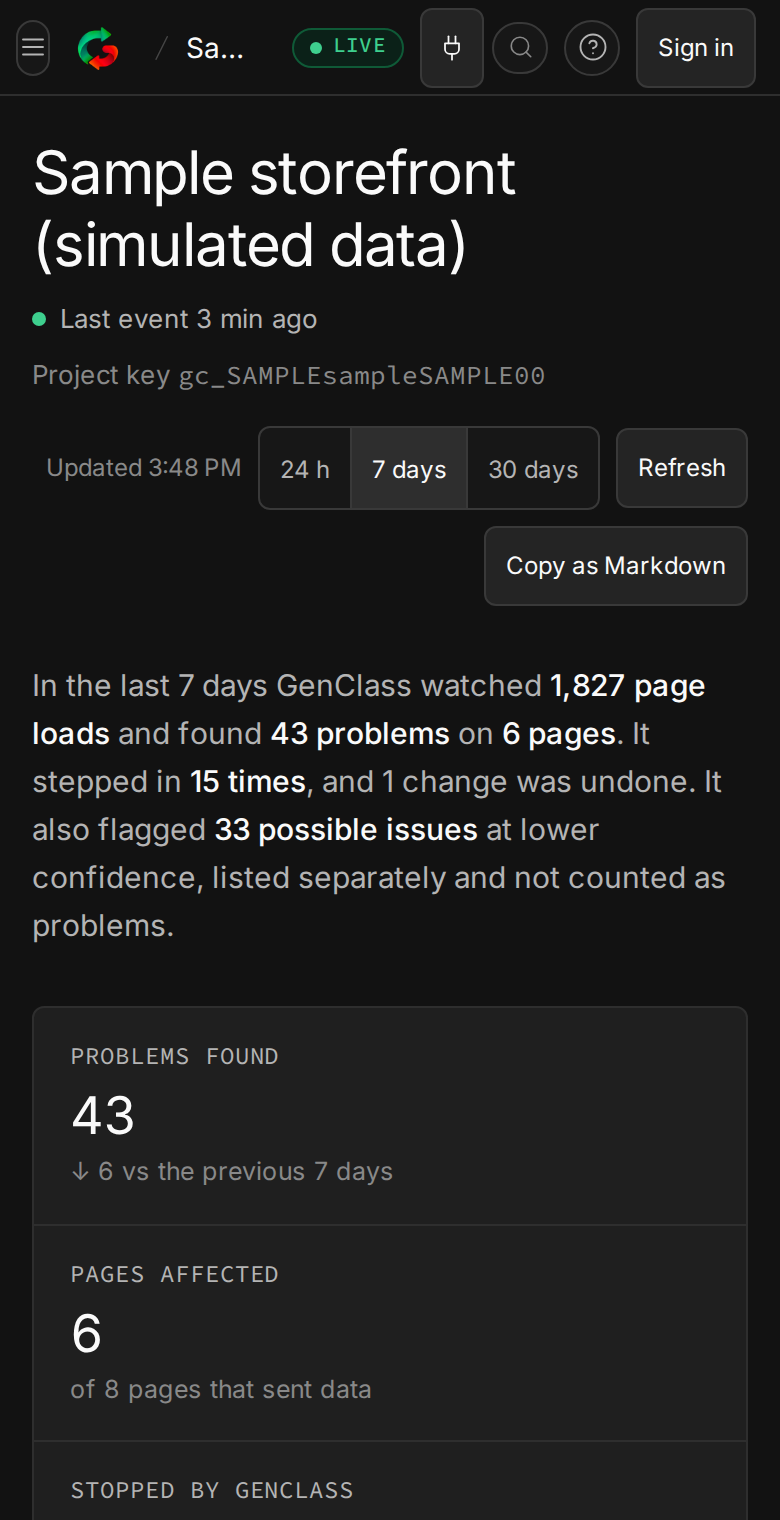
The overview has the project's name and status, one sentence on the period (page loads watched, problems found, times GenClass stepped in), four stats, and the problems found per hour or day by type. Under them, cards for page loads, problems, interventions and visits, one bar per hour or day; Get connected, to install GenClass, connect your coding agent or turn on analytics; and the problems that need attention first, each with Copy prompt.
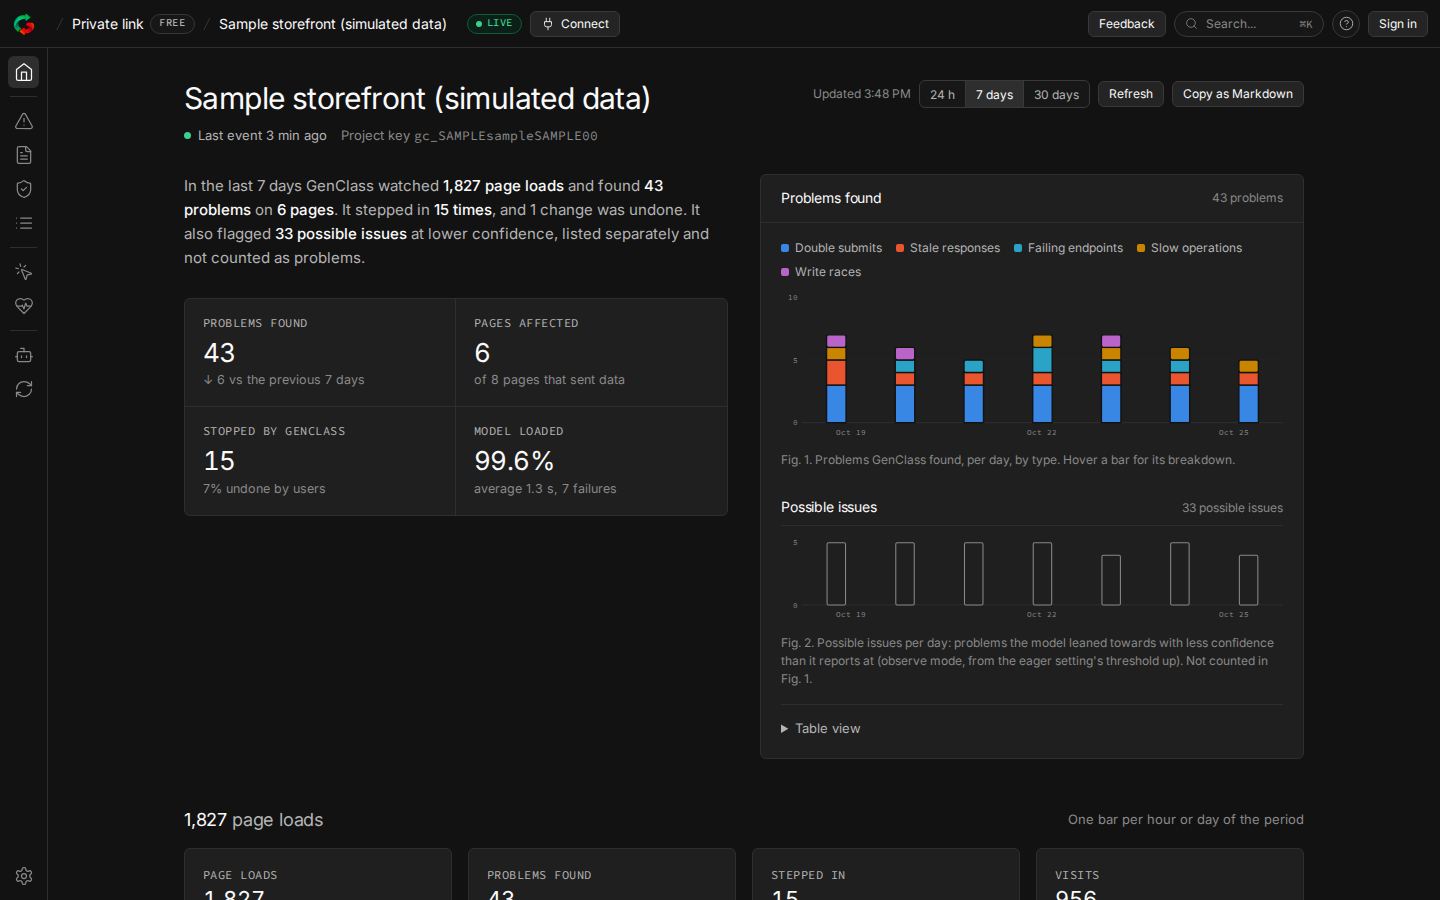
Time ranges
The buttons at the top right of each view pick the period: 24 hours (per hour) and 7 days on Free, up to 90 days on Pro; Enterprise adds a year. Every view follows the range, and the dashboard refreshes every minute while the tab is open.
Read a problem
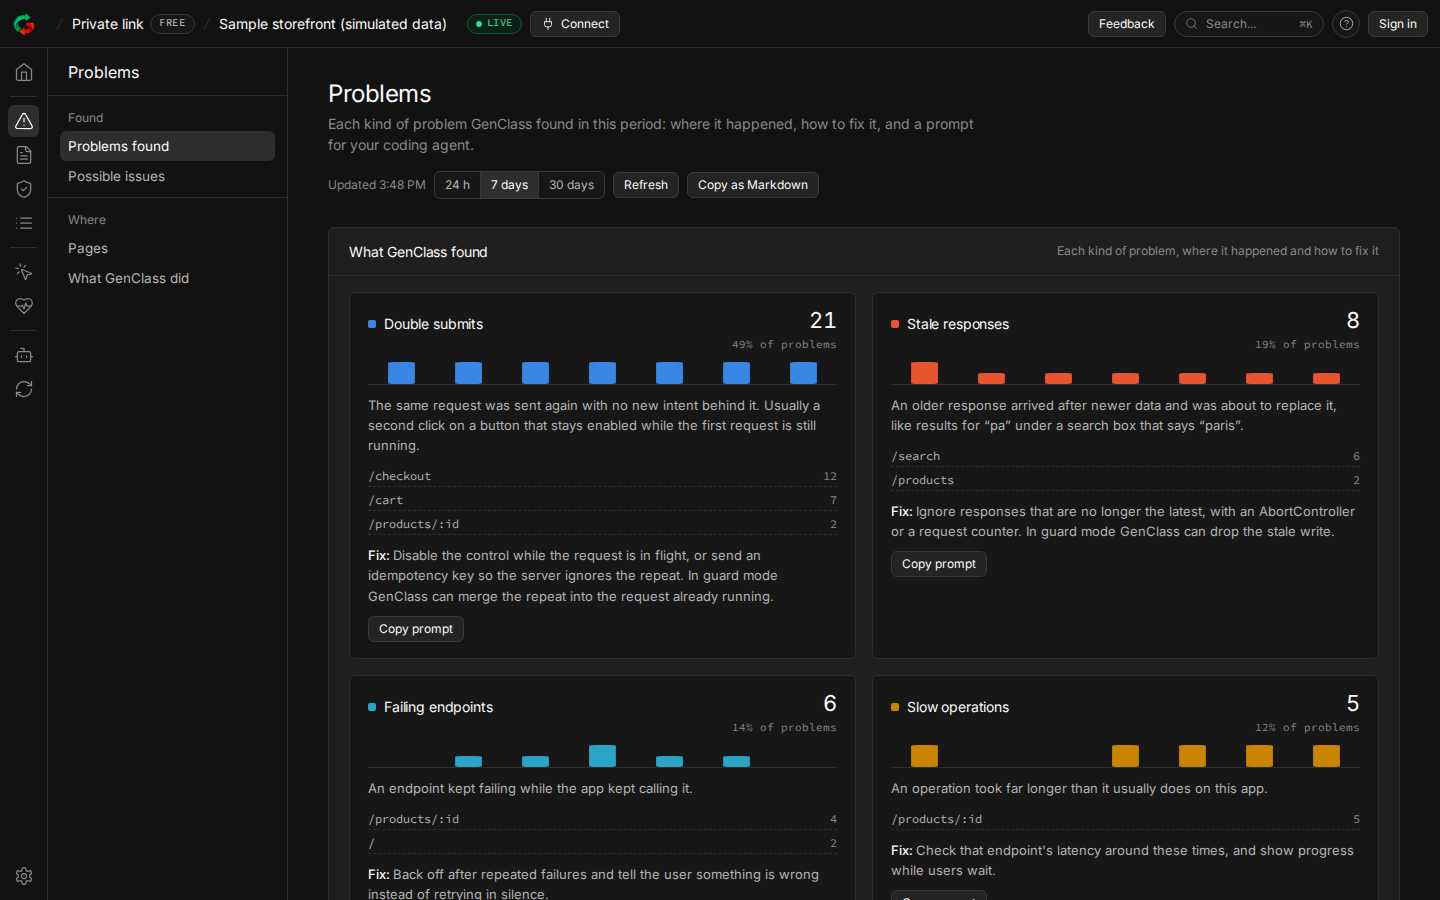
Each card in Problems is one kind of bug that never throws: double submits, stale responses, write races, failing endpoints, slow operations, failure storms and broken relations between fields. A card shows:
- how many times it happened in the period, and its share of all problems;
- a small chart of when, so a spike after a deploy stands out;
- the pages (routes) it happened on, most first;
- Fix: what to change in your code, and what guard mode can do about it meanwhile;
- Copy prompt: the same, written for your coding agent (below).
Possible issues are problems the model leaned towards with less confidence than it reports at. They are not counted as problems, but one that keeps coming back on the same page is worth a look. Think a report is wrong? Report a false detection.
Pages and actions
Pages lists routes by problems, with a bar per type, so you know where to start. Actions counts what GenClass did in guard or heal mode, such as merging a repeated request or dropping a stale write, and how many of those your users undid. In observe mode, the default, GenClass only reports and this table stays empty.
Visitors
Apps that turn on interaction analytics (analytics: true, from runtime 0.3.0-beta.1) also see page views, visits and where they come from, devices, entry and exit pages, funnels, engaged time, scroll depth, the most clicked elements, and rage and dead clicks, each on its own page of the Visitors menu. Elements are named by a selector or a name you give them (data-genclass-name), never by their text, and no visitor id exists, so unique visitors are not counted. It is free on every plan. For an app without analytics, the view is one button that copies the prompt that turns them on.
Health
Whether GenClass could watch your pages: the share of model loads that succeeded, WebGPU or WASM, average load and decision times, and the times it went ahead without a decision (the model not ready yet, a hidden tab). If something here looks wrong, the problems view can be missing things.
On your phone
The dashboard works on a phone: the menu button at the top left opens the rail, and every control is large enough for a thumb.
Your coding agent: MCP
The MCP view, and the MCP tab of the Connect dialog, set up @genclass/mcp for Claude Code, Cursor, VS Code, Codex, Claude Desktop, Windsurf or Gemini CLI. Pick your agent, then Copy prompt (your agent adds the server and checks it works) or copy the configuration yourself. With it your agent sees what happens inside your app's pages while you develop, re-runs them with the network answering in different orders to find races, and replays one exact order to prove a fix.
To read this project's production numbers as well, the server needs the project's agent link (GENCLASS_DASHBOARD). On a private link it is the page's own address. In an account, Create agent link makes one, shown once; the configuration and the prompt fill it in. It opens the project's stats, read only, to anyone who has it, so keep it out of files you commit (the configurations it gives put it in your own settings, not the repository). Making a new one turns the old one off, and you can turn it off on the project's card.

Prompts and Markdown
Copy prompt, on each problem and on the overview, copies what your coding agent needs: the kind of problem, how often and on which pages, the usual fix, and the MCP steps that reproduce it, test it and prove the fix. Copy as Markdown, at the top right of every view, copies the period as a short report (the totals, each kind of problem with its pages and fix, the latest detections) to paste into a chat, an issue or a pull request.
Integrations
In a project's Integrations view, connect Sentry, PostHog, Datadog, Slack or a signed webhook, and each new likely problem goes there too, from our server, with no code in your app. A record has the problem type, confidence, page route, versions and a link back to the dashboard, never page text. The same problem on the same page is sent at most once an hour, and an app sends at most 60 records an hour. Comes with Pro.
Export
Project Settings, Export downloads every event GenClass received for the app as JSON Lines or CSV, or gives you an export key for the API (GET /api/account/projects/<id>/events). It comes with Pro and covers 90 days, 1 year on Enterprise.
Who sees what
The dashboard shows counts only: the kind of problem, the page route, confidence, what GenClass did and how fast it decided. No text from your pages, no IP addresses and no user agents are stored. A project in your account is visible to you while signed in; a project with a private link (or an agent link, which is one) is visible to anyone with the link, and you can turn the link off. The data passes through GenClass's collector, and the GenClass maintainers use it to improve the model; every field is listed here.
Private mode: your own collector
If your data should never pass through us, run the same open-source collector on your own Cloudflare account. It gives you the same dashboards and accounts on your own domain, and nothing reaches GenClass. It takes about ten minutes with wrangler, and the free tiers are enough to start:
git clone https://github.com/genclass-dev/GenClass && cd GenClass-lib/telemetry-worker
npx wrangler login
npx wrangler r2 bucket create genclass-telemetry
npx wrangler d1 create genclass-dashboard     # paste its id into wrangler.selfhost.toml, set your worker's URL there
npx wrangler d1 migrations apply genclass-dashboard --remote -c wrangler.selfhost.toml
npx wrangler deploy -c wrangler.selfhost.toml
Then open https://<your worker>/start. Its snippets already send to your collector:
GenClass.init({ token: "gc_...", telemetry: { endpoint: "https://<your worker>/v1/events" } });The full steps, accounts and forwarding on your own collector are in the collector's README. To send nothing at all, turn telemetry off: telemetry: false; the runtime works the same, without a dashboard.
Questions
Does the dashboard cost anything? Free shows one app's totals. Every problem, export and alerts come with Pro, US$50 a developer a month (pricing).
How long is data kept? Kept 90 days on every plan. The dashboard shows 7 days on Free (hourly detail for 48 hours), 90 days on Pro and 1 year on Enterprise.
The dashboard stays empty. Check that the page runs @genclass/runtime 0.3.0-beta.0 or later with the key, that telemetry is on, and that you are looking at a deployed site (local hosts do not send by default). The Connect dialog says when the first event arrives.
Can I try it without my own app? Yes: the sample dashboard shows a week of a simulated storefront.