Efficiently Cleaning Text with Pandas
Posted by Chris Moffitt in articles

Introduction
It’s no secret that data cleaning is a large portion of the data analysis process. When using pandas, there are multiple techniques for cleaning text fields to prepare for further analysis. As data sets grow large, it is important to find efficient methods that perform in a reasonable time and are maintainable since the text cleaning process evolves over time.
This article will show examples of cleaning text fields in a large data file and illustrates tips for how to efficiently clean unstructured text fields using Python and pandas.
The problem
For the sake of this article, let’s say you have a brand new craft whiskey that you would like to sell. Your territory includes Iowa and there just happens to be an open data set that shows all of the liquor sales in the state. This seems like a great opportunity for you to use your analysis skills to see who the biggest accounts are in the state. Armed with that data, you can plan your sales process for each of the accounts.
Excited about the opportunity, you download the data and realize it’s pretty large. The data set for this case is a 565MB CSV file with 24 columns and 2.3M rows. This is not big data by any means but it is big enough that it can make Excel crawl. It’s also big enough that some of the pandas approaches will be relatively slow on your laptop.
For this article, I’ll be using data that includes all of 2019 sales. Due to the size, you can download it from the state site for a different time period.
Let’s get started by importing our modules and reading the data. I will also use the sidetable package to summarize the data. It’s not required for the cleaning but I wanted to highlight how useful it can be for these data exploration scenarios.
The data
Let’s get our data :
import pandas as pd
import numpy as np
import sidetable

df = pd.read_csv('2019_Iowa_Liquor_Sales.csv')
Here’s what the data looks like.
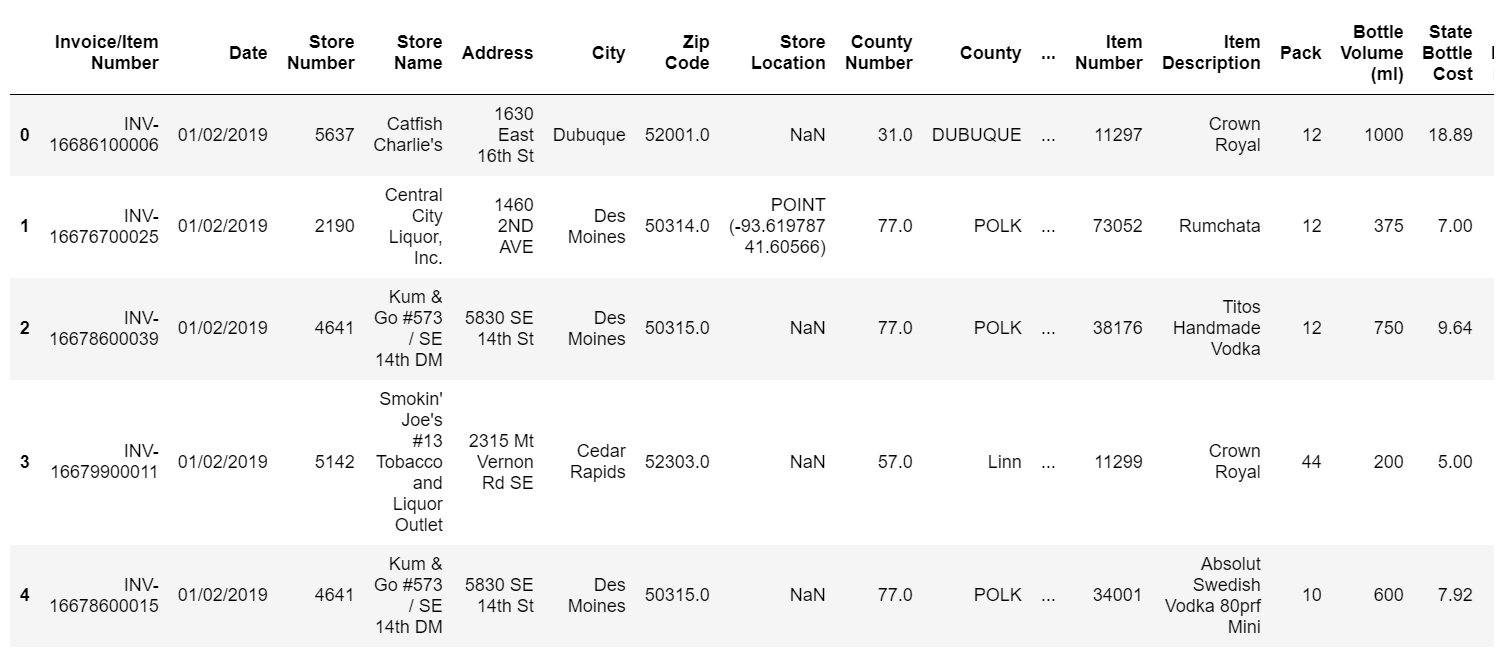
The first thing we might want to do is see how much each store purchases and rank them from the largest to the smallest. We have limited resources so we should focus on those places where we get the best bang for the buck. It will be easier for us to call on a couple of big corporate accounts instead of a lot of mom and pop stores.
sidetable
is a shortcut to summarize the data in a readable format. The alternative
is doing a
groupby
plus additional manipulation.
df.stb.freq(['Store Name'], value='Sale (Dollars)', style=True, cum_cols=False)

One thing that’s apparent is that the store names are unique per location in most cases. Ideally we would like to see all the sales for Hy-Vee, Costco, Sam’s, etc grouped together.
Looks like we need to clean the data.
Cleaning attempt #1
The first approach we can investigate is using
.loc
plus a boolean filter with
the
str
accessor to search for the relevant string in the
Store Name
column.
df.loc[df['Store Name'].str.contains('Hy-Vee', case=False), 'Store_Group_1'] = 'Hy-Vee'
This code will search for the string ‘Hy-Vee’ using a case insensitive search and store the value
“Hy-Vee” in a new column called
Store_Group_1
. This code will effectively convert names
like “Hy-Vee #3 / BDI / Des Moines” or “Hy-Vee Food Store / Urbandale” into a common “Hy-Vee”.
Here’s what
%%timeit
tells us about this performance:
1.43 s ± 31.8 ms per loop (mean ± std. dev. of 7 runs, 1 loop each)
Normally we don’t want to optimize too early in the process but one thing we can do is use
the
regex=False
parameter to give a speedup:
df.loc[df['Store Name'].str.contains('Hy-Vee', case=False, regex=False), 'Store_Group_1'] = 'Hy-Vee'
804 ms ± 27.9 ms per loop (mean ± std. dev. of 7 runs, 1 loop each)
Here are the counts in the new column:
df['Store_Group_1'].value_counts(dropna=False)
NaN       1617777
Hy-Vee     762568
Name: Store_Group_1, dtype: int64
We’ve cleaned up Hy-Vee but now there are a lot of other values we need to tackle.
The
.loc
approach contains a lot of code and can be slow. We can use this concept
but look for some alternatives that are quicker to execute and easier to maintain.
Cleaning attempt #2
Another approach that is very performant and flexible is to use
np.select
to run multiple
matches and apply a specified value upon match.
There are several good resources that I used to learn how to use
np.select
. This
article from Dataquest is a good overview. I also found this presentation from Nathan Cheever
very interesting and information. I encourage you to check both of these out.
The simplest explanation for what
np.select
does is that it evaluates a list of conditions and
applies a corresponding list of values if the condition is true.
In our case, our conditions will be different string lookups and the normalized string we want to use instead will be the value.
After looking through the data, here’s a list of conditions and values in the
store_patterns
list. Each tuple in this list is a
str.contains()
lookup and the corresponding
text value we want to use to group like accounts together.
store_patterns = [
    (df['Store Name'].str.contains('Hy-Vee', case=False, regex=False), 'Hy-Vee'),
    (df['Store Name'].str.contains('Central City',
                                case=False,  regex=False), 'Central City'),
    (df['Store Name'].str.contains("Smokin' Joe's",
                                case=False,  regex=False), "Smokin' Joe's"),
    (df['Store Name'].str.contains('Walmart|Wal-Mart',
                                case=False), 'Wal-Mart'),
    (df['Store Name'].str.contains('Fareway Stores',
                                case=False,  regex=False), 'Fareway Stores'),
    (df['Store Name'].str.contains("Casey's",
                                case=False,  regex=False), "Casey's General Store"),
    (df['Store Name'].str.contains("Sam's Club", case=False,  regex=False), "Sam's Club"),
    (df['Store Name'].str.contains('Kum & Go',  regex=False, case=False), 'Kum & Go'),
    (df['Store Name'].str.contains('CVS',  regex=False, case=False), 'CVS Pharmacy'),
    (df['Store Name'].str.contains('Walgreens',  regex=False, case=False), 'Walgreens'),
    (df['Store Name'].str.contains('Yesway',  regex=False, case=False), 'Yesway Store'),
    (df['Store Name'].str.contains('Target Store',  regex=False, case=False), 'Target'),
    (df['Store Name'].str.contains('Quik Trip',  regex=False, case=False), 'Quik Trip'),
    (df['Store Name'].str.contains('Circle K',  regex=False, case=False), 'Circle K'),
    (df['Store Name'].str.contains('Hometown Foods',  regex=False,
                                case=False), 'Hometown Foods'),
    (df['Store Name'].str.contains("Bucky's", case=False,  regex=False), "Bucky's Express"),
    (df['Store Name'].str.contains('Kwik', case=False,  regex=False), 'Kwik Shop')
]
One of the big challenge when working with
np.select
is that it is easy to get the
conditions and values mismatched. I’ve decided to combine into a tuple to more easily keep
track of the data matches.
Because of this data structure, we need to break the list of tuples into two separate lists.
Using
zip
we can take the
store_patterns
and break into
store_criteria
and
store_values
:
store_criteria, store_values = zip(*store_patterns)
df['Store_Group_1'] = np.select(store_criteria, store_values, 'other')
This code will fill in each match with the text value. If there is no match, we’ll assign it the value ‘other’.
Here’s what it looks like now:
df.stb.freq(['Store_Group_1'], value='Sale (Dollars)', style=True, cum_cols=False)

This looks better but there is still 32.28% of our revenue in “other” accounts.
What might be nice is that if there is an account that doesn’t match, we use the
Store Name
instead of lumping all together in other. Here’s how we do that:
df['Store_Group_1'] = np.