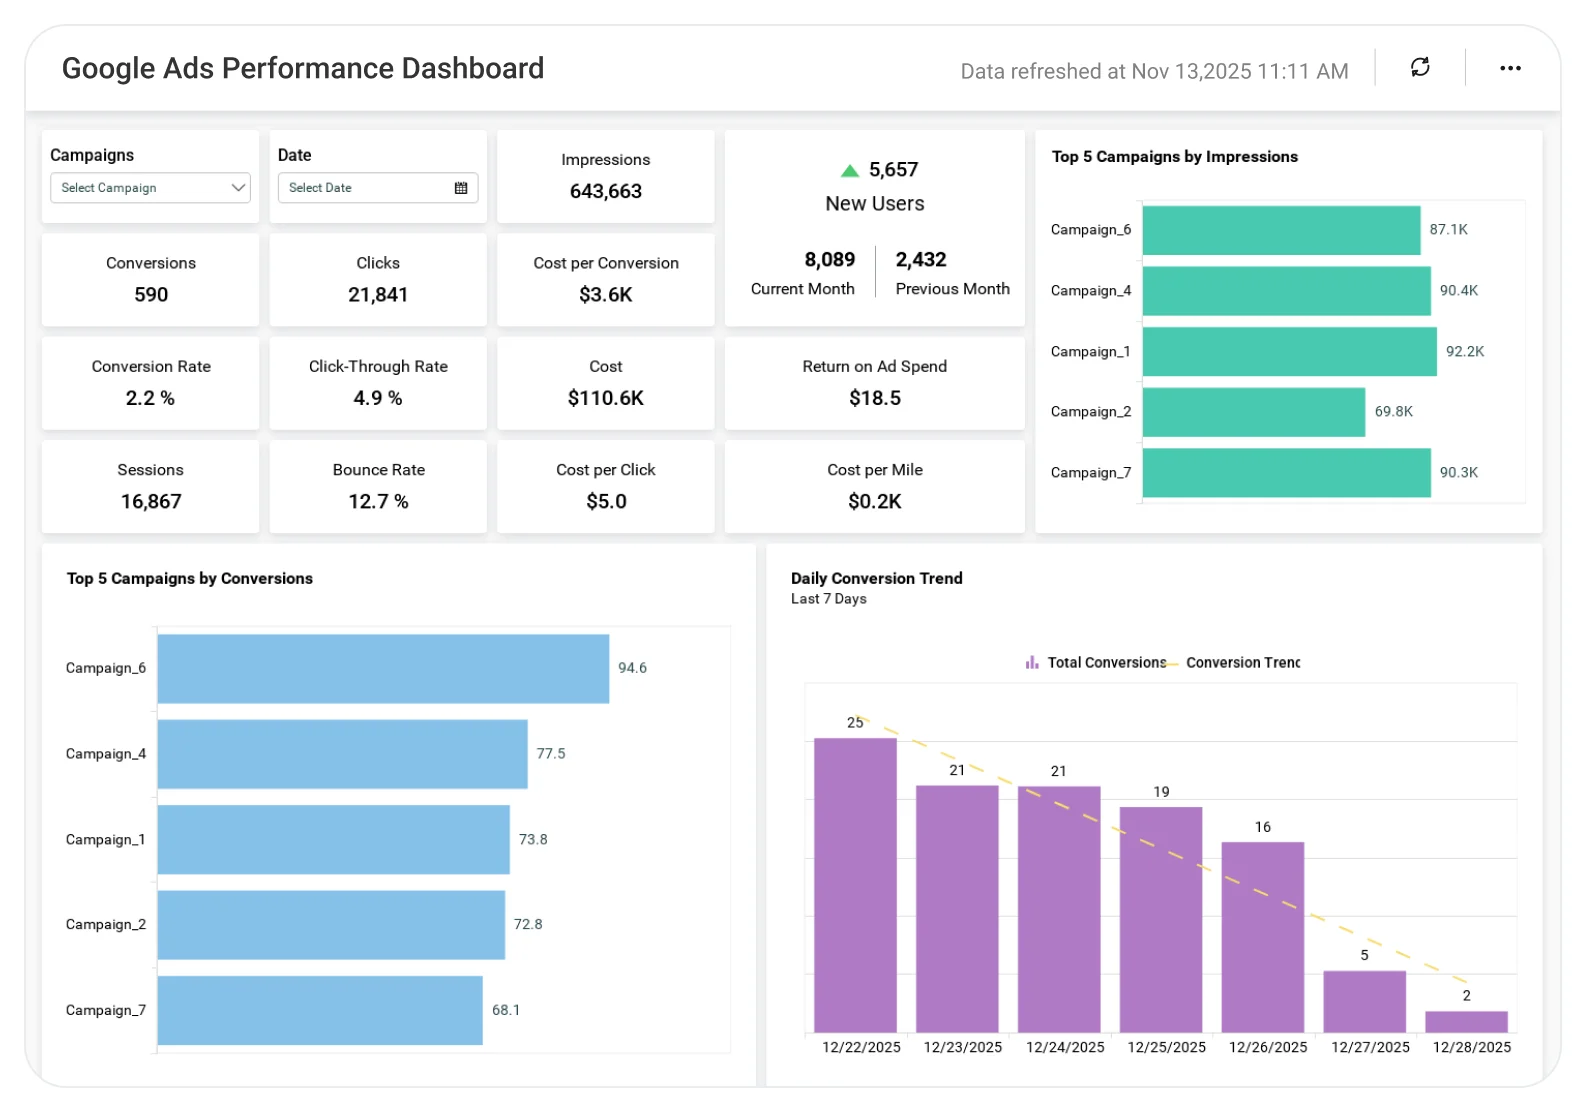
Track marketing performance, optimize campaigns, and prove ROI with real-time dashboards.
Marketing teams manage multiple channels, from website traffic and email campaigns to paid ads and lead nurturing. To drive demand, revenue, and growth, teams need clear visibility into performance and ROI without juggling disconnected tools or spreadsheets.
Bold BI provides real-time, customizable marketing dashboards that unify traffic, campaign, lead, and revenue data, helping teams optimize spend, improve lead quality, and clearly show marketing’s impact on revenue.
Bold BI’s marketing dashboards put campaign KPIs at your fingertips, helping teams maximize ROI and efficiency.
Website & Engagement Performance: Monitor visitors, sessions, bounce rate, session duration, and conversion trends across traffic sources. Identify which channels drive high-quality engagement and optimize content and landing pages accordingly.
Lead Generation & Funnel Insights: Track leads, MQLs, SQLs, and funnel conversion rates. Analyze lead sources, campaign attribution, and drop-off points to improve lead quality and sales alignment.
Campaign Performance & Spend: Measure email campaigns, paid ads, and organic initiatives using metrics like CTR, open rates, impressions, and cost per lead. Compare campaign performance to optimize budget allocation.
Marketing ROI & Revenue Impact: Gain visibility into customer acquisition cost, marketing ROI, pipeline contribution, and revenue attribution by channel or campaign to prove marketing’s business impact.
All dashboards are fully customizable for teams to add or adjust KPIs based on campaign goals, regions, or business priorities.
Bold BI for Marketing – Common Metrics
With fully customizable dashboards, you can track the KPIs that matter most:
Website traffic & engagement metrics
Lead volume (leads, MQLs, SQLs)
Conversion rates across channels
Cost per lead and customer acquisition cost (CAC)
Campaign performance metrics (CTR, open rate, engagement)
Marketing ROI and revenue attribution
Channel-wise performance trends
Funnel progression and drop-off analysis
All dashboards can be tailored for content marketing, demand generation, digital advertising, email marketing, and more.
How It Works
Connect Data Sources: Integrate Google Analytics, ad platforms, CRM systems, email tools, SQL databases, Excel, and cloud sources.
Use Pre-Built or Custom Dashboards: Start quickly with marketing dashboard samples or design your own.
Blend Key Marketing Data: Combine traffic, lead, campaign, and revenue information to answer key questions such as:
Which channels generate the best leads?
Which campaigns deliver the highest ROI?
Where are prospects dropping off in the funnel?
Collaborate Securely: Share dashboards across teams with governed access.
Stay Proactive: Set alerts for performance changes to act quickly.
Trusted & recognized
Analytics that wins awards and users
Recognized by G2, TrustRadius, and Visual Studio Magazine for delivering standout performance and value.
I appreciate Bold BI for making it easier to provide reporting for our customers, allowing both our analysts and customers to easily build and publish reports. The ability to build dashboards and modify queries for specific outcomes is very user-friendly. I value the mobile readiness of the app and its integration capabilities with API structures. The addition of AI features is impressive. The economic pricing model and the effective partnership, which includes consistent and helpful support, make it an invaluable tool for our OEM model.
Ravi S.
The support from Bold is unmatched. They do not charge extra for support and it is excellent anyway. All our tickets and questions are quickly answered with authoritative and precise guidance. This is important at the product is complex, powerful and mature. To get the most out of the tool, the level of support they provide is essential.
Murph M.
It was easy to implement data visualizations into our product. The standard widgets allowed us to build professional looking dashboards, and a robust API provided excellent control of the development and runtime process from within our application.
Scott Y.
RECOGNITION
Users Love Us
Visual Studio Reader's Choice - 2025
Leader - Fall 2025
High Performer - Fall 2025 EMEA
Regional Leader - Fall 2025 AMERICAS
TrustRadius Tech Cares
Capterra - 4.9/5
G2- 4.4/5
GetApp - 4.9/5
Software Advice - 4.9/5
Frequently Asked Questions
Yes. Bold BI connects with analytics tools, ad platforms, CRM systems, Excel, SQL, and cloud data sources.
Absolutely. Bold BI blends cost, lead, and revenue data to calculate true marketing ROI.
Yes, each team can have customized dashboards with role-based access.
Yes. Bold BI supports both cloud and self-hosted deployment options.
Most teams start visualizing marketing KPIs within hours. More complex integrations depend on data sources.
In this blog post, a detailed overview of the top 10 marketing dashboards is provided. These examples are intended to help achieve specific business goals and demonstrate how dashboards can be used in any application.