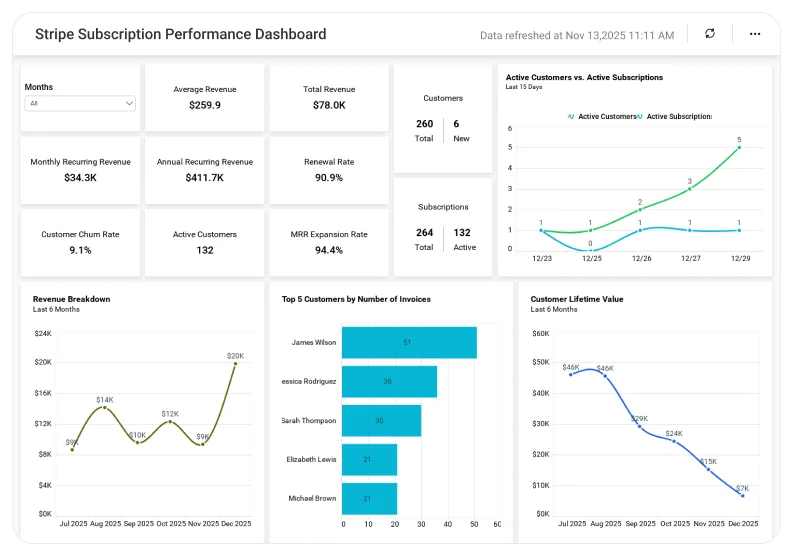
Bold BI empowers sales teams by consolidating CRM, pipeline, and revenue data, helping businesses forecast accurately, optimize performance, and close deals more efficiently.
Full Pipeline Visibility: Track leads, deals, and stages in real time as they progress through the pipeline.
Revenue Forecasting: Visualize trends, quotas, and forecasts by region or product to plan more effectively.
Sales Performance Insights: Identify top-performing reps and provide coaching for underperformers to boost results.
Conversion Optimization: Spot bottlenecks in the sales cycle and improve win rates with data-driven strategies.
Enterprise-Grade Security: Safeguard sensitive sales data with RLS, SSO, RBAC, and on-premises deployment support.
What You’ll Track
Bold BI’s customizable dashboards put the sales KPIs you depend on at your fingertips, making it easy to improve transparency, efficiency, and overall business growth.
Revenue Performance: Monitor total sales, revenue growth trends, and average deal size to understand overall business performance and identify opportunities for improvement.
Sales Pipeline: Track leads, opportunities, and conversion rates across different stages of the sales funnel to optimize the process and forecast future revenue accurately.
Team Productivity: Measure individual and team performance by analyzing the number of calls, meetings, and closed deals to ensure accountability and efficiency.
Customer Insights: Visualize customer acquisition costs, retention rates, and lifetime value to refine targeting strategies and improve customer relationships.
Operational Metrics: Keep an eye on order fulfillment times, delivery accuracy, and inventory levels to maintain smooth operations and enhance customer satisfaction.
Choose Dashboards: Start quickly with prebuilt samples or design custom layouts tailored to your sales workflows.
Analyze Sales Data: Gain insights into pipeline health, revenue trends, customer activity, and forecasts to drive growth.
Collaborate Securely: Share dashboards with sales managers and executives using RLS, SSO, and RBAC for enterprise-grade security.
Stay Proactive: Set up alerts for declining pipeline health or missed targets to take timely action.
Trusted & recognized
Analytics that wins awards and users
Recognized by G2, TrustRadius, and Visual Studio Magazine for delivering standout performance and value.
I appreciate Bold BI for making it easier to provide reporting for our customers, allowing both our analysts and customers to easily build and publish reports. The ability to build dashboards and modify queries for specific outcomes is very user-friendly. I value the mobile readiness of the app and its integration capabilities with API structures. The addition of AI features is impressive. The economic pricing model and the effective partnership, which includes consistent and helpful support, make it an invaluable tool for our OEM model.
Ravi S.
The support from Bold is unmatched. They do not charge extra for support and it is excellent anyway. All our tickets and questions are quickly answered with authoritative and precise guidance. This is important at the product is complex, powerful and mature. To get the most out of the tool, the level of support they provide is essential.
Murph M.
It was easy to implement data visualizations into our product. The standard widgets allowed us to build professional looking dashboards, and a robust API provided excellent control of the development and runtime process from within our application.
Scott Y.
RECOGNITION
Users Love Us
Visual Studio Reader's Choice - 2025
Leader - Fall 2025
High Performer - Fall 2025 EMEA
Regional Leader - Fall 2025 AMERICAS
TrustRadius Tech Cares
Capterra - 4.9/5
G2- 4.4/5
GetApp - 4.9/5
Software Advice - 4.9/5
Frequently Asked Questions
Bold BI consolidates CRM and revenue data to provide real-time insights into pipeline health and sales trends.