
Microsites + Interactive
WHAT WE DO
We turn complex information into interactive tools and experiences people can use.
RELATED WORK
Accenture: Making the journey to intelligent operations visible
ExcelinEd: Turning policy data into real-world impact
ExcelinEd: How 40 school choice policies across 50 states became one navigable tool
Federal Reserve Bank of St. Louis: Making complex economic systems understandable
Future of Privacy Forum: Mapping the privacy implications of a connected world
Greater St. Louis, Inc.: A data platform for measuring regional growth
Insightful Education Solutions: The data wasn’t the problem. The language was.
REACH at Rush: My child wants a career in healthcare. Where do we start?

Making complex economic systems understandable
PUBLIC POLICY
CLIENT
Federal Reserve Bank of St. Louis
INDUSTRY
Public policy
Financial services
PROJECT
Interactive modules
Information architecture
Data visualization
Narrative design
User experience design
DOWNLOAD
Save the case study as a PDF
The Federal Reserve Bank of St. Louis helps explain how the Federal Reserve works, including GDP and the Federal Open Market Committee (FOMC), which sets interest rates. The committee’s voting structure is complex.
INSIGHT
And the system isn’t static. Voting rights rotate across Reserve Banks, making it difficult to explain with diagrams or spreadsheets.
People needed a way to explore the system, not just read about it.
SOLUTION
We built interactive modules that allow users to explore the system visually.
For the FOMC, the module shows how voting rotates across Reserve Banks and how decisions are made. For GDP, we created a more narrative experience that walks users through how it works.
The result is a set of tools that make complex systems understandable and explorable.
The St. Louis Fed can now clearly explain how GDP and the FOMC voting system work, and how the Federal Reserve serves the public.
Compared to the spreadsheet previously used, the interactive modules are easier to explore, easier to understand, and easier to share. They function as a modern, user-focused way to explain how the system works.
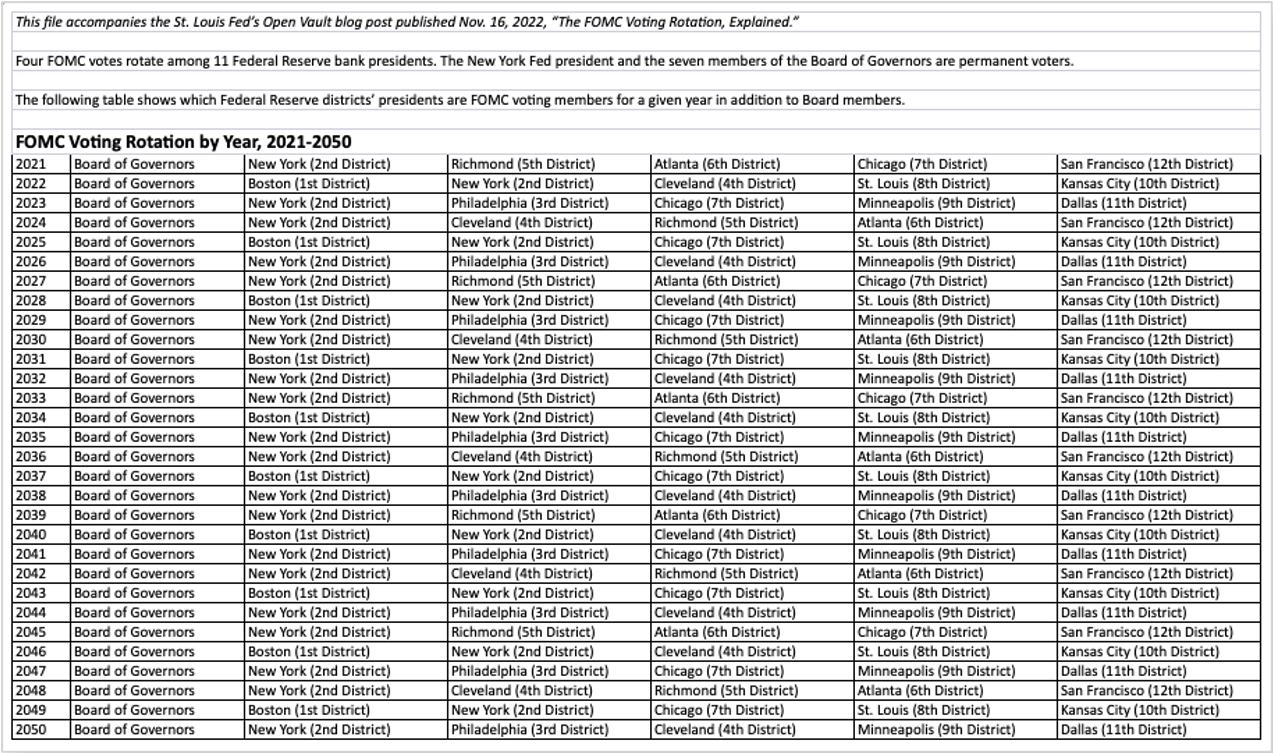
The before — intense
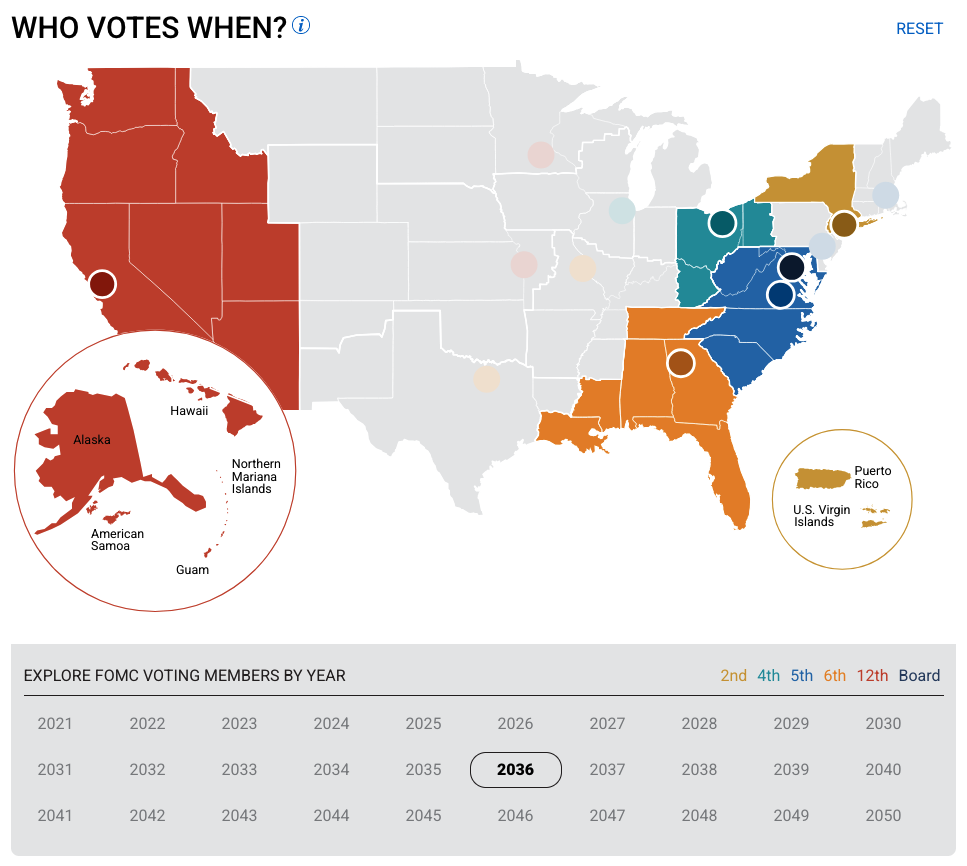
The after — interactive

Walking through the formula for GDP